Configure Schematics
In Wood InsightsPlatform (WIP), you can create, edit or delete schematics using the Schematic Editor as described below.
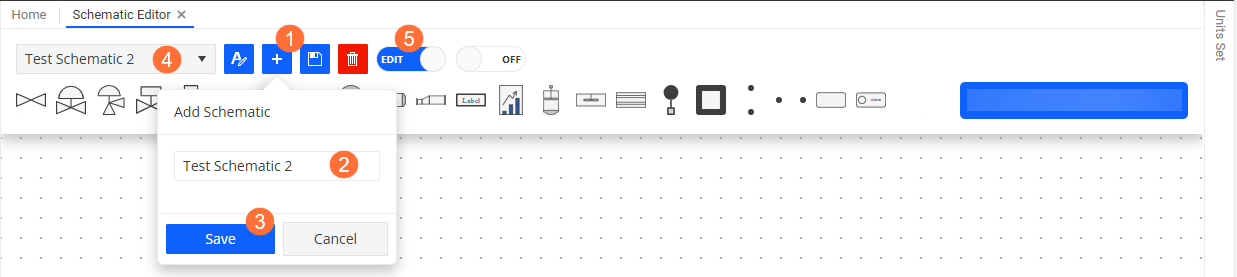
Set Up Schematics
Choose from the menu.
On the Schematic Editor pane, click
 on the toolbar on the top of the page.
Enter a name for the new schematic and click Save.
Select the new schematic for editing from the drop-down field on the toolbar.
Switch to editing mode using the View/Edit toggle button on the toolbar.
Result
A new row is added to the toolbar containing various schematic elements.
Use the following functions to set up your schematics:
Add Elements
To add a new element, drag the required element from the toolbar and drop it to the editor screen area. You can drag around the element to the required location whenever it is required.
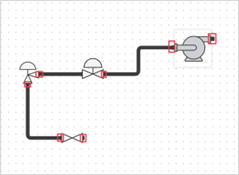
Connect Elements
Each element has a handle that indicates possible connection points. Press a connection point and drag it to connection point of another element to form a connection.
Delete Elements
To delete an element, select it and press Delete / Backspace on your keyboard.
Configure Elements
When you click an element in the editor, a dialog appears, where you can define properties specific to the element type. For more information, see Configure Schematic Elements.
Copy&Paste Elements
You can use the standard Ctrl+C and Ctrl+V keyboard shortcuts to copy and paste schematic elements.
Toggle Snap Modes
You can use the SNAP/OFF toggle button on the toolbar to switch between auto snap and free place modes. This determines whether nodes are aligned based on their proximity to other nodes.
Click
 on the toolbar to save your changes.
Caution
To prevent losing your changes, remember to save your work regularly. The editor automatically saves every 5 minutes, but it’s crucial to manually save your work before switching to other schematics.
Edit Schematics
In the Schematic Editor pane, you can edit schematics in the following ways:
You can update the name of a schematic in any view (View/Edit) by using the
 button on the toolbar and changing the name as required.
You can change schematics, that is add, remove, or move around elements or connections by switching to editing mode using the View/Edit toggle button on the toolbar and using the functions described in Set Up Schematics.
You can edit individual elements of schematics as described in Configure Schematic Elements.
Configure Schematic Elements
In the Schematic Editor pane, you can configure the properties of elements by clicking them in Editing mode (View/Edit toggle button switched to Edit) and filling in fields in the dialog that opens. The available options in the dialog depend on the type of the element.
Many of the schematic elements have the Chart Options section in the configuration dialog, which allows you to assign a chart to the element. This chart will appear when the user clicks the relevant node when viewing the schematics. In this section you define the following parameters:
Field |
Description |
|---|---|
Chart Title |
Specify a title for the chart, which will appear at the top of the chart. |
Legend Title |
Enter a title to be applied for the legend. |
Tag |
Select the tag that you want to assign to the schematic element. |
Averaging Period |
Select the time interval for averaging data points displayed on the chart. Options include None, 10 minutes, 1 hour, and 1 day. Choosing None displays raw values, while selecting a time interval applies averaging over the specified period, showing averaged values on the chart. |
Start/End |
Select the beginning and ending date for the period to be displayed on the chart. These fields allow you to customise the time frame of the data displayed, ensuring you can focus on the specific period of interest. |
Other configuration options are specific to the element type. For more information, click the relevant element type below:
Valves
You can choose from six different types of valves:
Gate Valve
Control Valve
Choke Valve
Actuator Valve
Cylinder Actuated Valve
Hand Valve
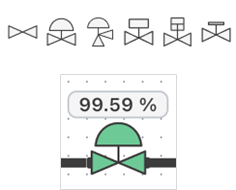
The value of the valve will be displayed automatically above it. You can use the general Chart Options configuration options for each valve. You can also assign a data map to each valve, which will change its color based on a specified value. For more information, see Configure Schematic Data Maps.
Pumps
Text
Compressors
Text
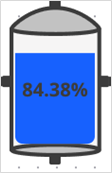
Tanks
You can use the general Chart Options configuration for tank elements. Additionally, you can assign a data map to each tank, allowing it to change color based on a specified value.
Tanks are unique in that they can visually indicate a liquid level on the node. This is automatically done once a tag has been assigned to the node.
Vessels
Pigs
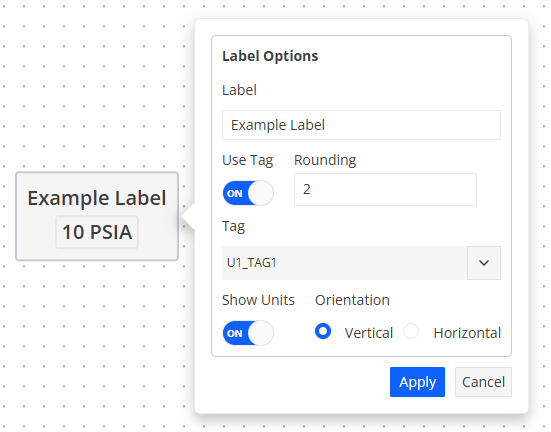
Labels
Labels can be used to display text or text with a tag value. By enabling the Use Tag option, additional fields will appear, which allow you to assign a tag, apply rounding to its value and specify how the value appears on the label.
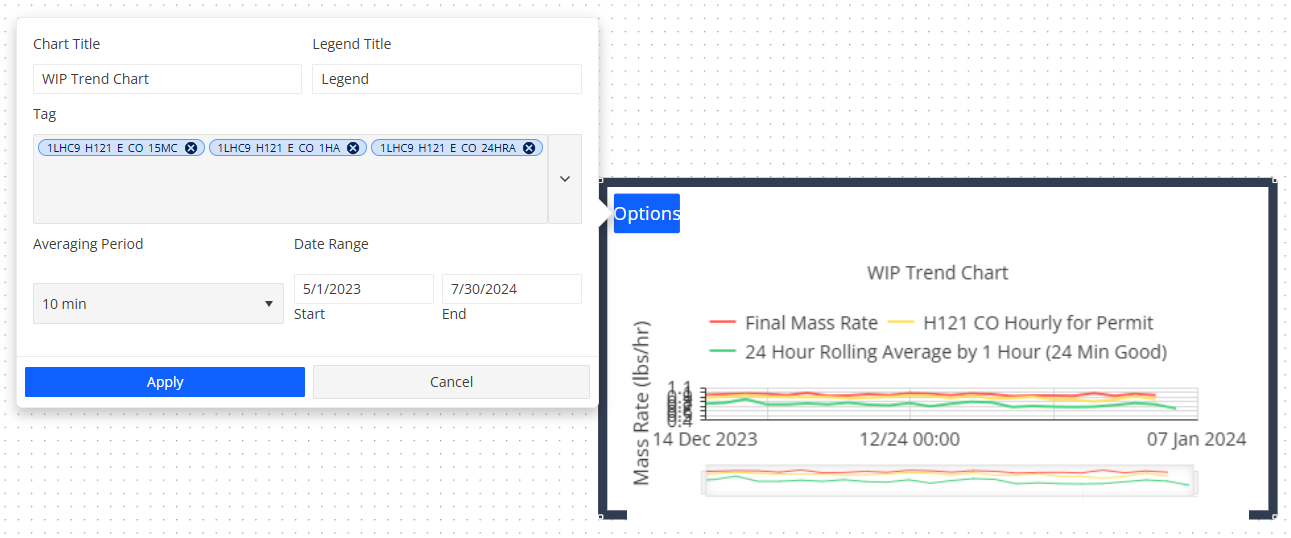
Charts
Charts can be placed on schematics to visually show how data changes over time. You can assign multiple tags to a chart node using the Options button in the upper left corner of the element. The historical values of each tag will be distinguishable by color, as indicated by the legend above the chart.
Mixers
Heat Exchangers
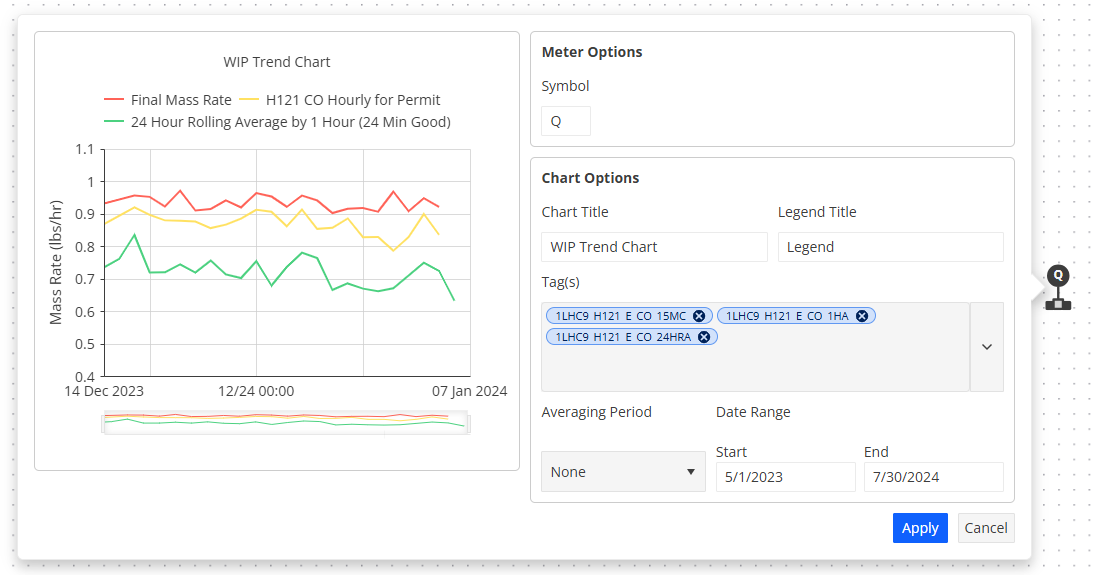
Meters
Meters have a “symbol” parameter that is displayed on the node itself. You can assign this symbol in the element’s configuration options. Additionally, you can assign multiple tags to meters, allowing them to display historical values for different tags.
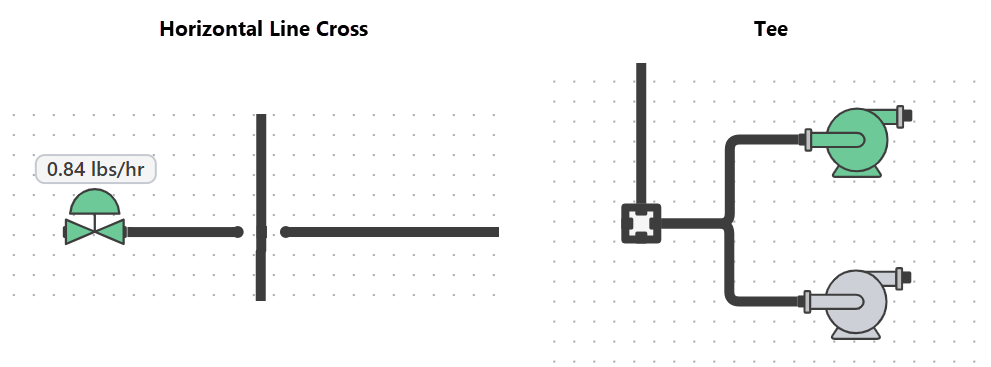
Tees/Crosses
Tees and crosses are special nodes used to represent junctions or jumps over lines in schematics.
Tee: A four-way connecting point that allows for the intersection of lines.
Cross: Represents a line jump, allowing lines to pass over each other without intersecting. There are two types of crosses:
Horizontal Cross: Represents a horizontal line jump.
Vertical Cross: Represents a vertical line jump.
Source Destinations
Alarms
Alarms are similar to labels, but they have additional features. They can be assigned a data map and are capable of displaying a light based on the value of the assigned tag.
See also