Schematics
Wood InsightsPlatform (WIP) enables the construction and visualisation of data for processes such as oil and gas, chemicals, and refining. Traditional dashboard interfaces may not be ideal for these visualisations, so WIP includes a specialised visual element known as schematics.
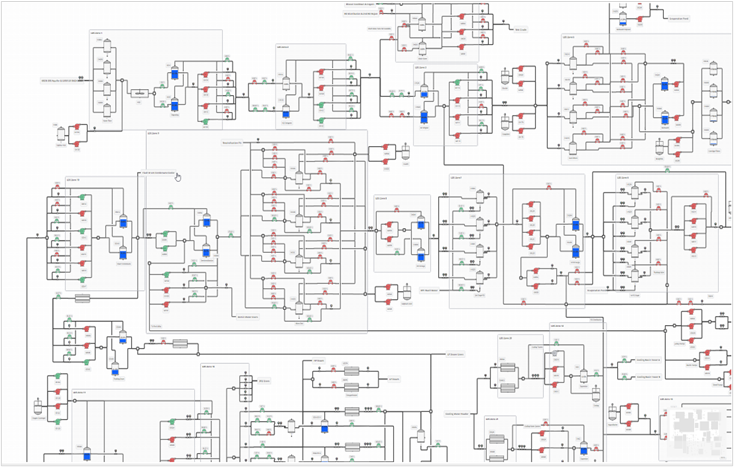
For example, the figure below illustrates a complex water processing plant. This example demonstrates how piping elements can be connected to other equipment elements in the WIP library, such as valves, pumps, and vessels. The colours in the figure correspond to WIP tag values:
Prerequisites
Before you can review schematics, they must be set up and configured as described in Configure Schematics.
Review Schematics
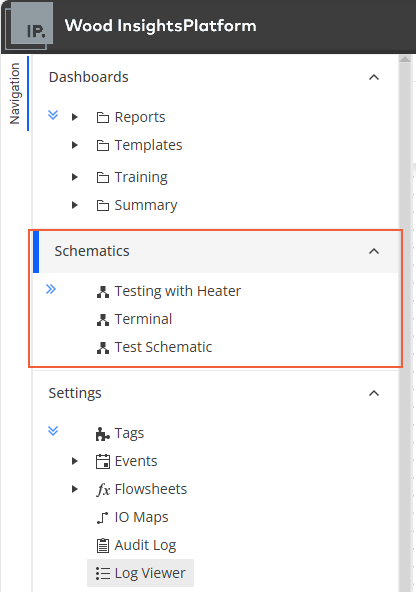
You can access the schematics created in the system under the Schematics section of the Navigation sidebar, which is a collapsible and expandable panel.
The viewer loads the selected schematic directly and shows a loading message while it is being retrieved. If loading fails or the diagram data is invalid, an error appears with a Retry button instead of leaving a blank canvas.
The viewer is always read-only, regardless of the editor’s View/Edit preference. You can pan, zoom, inspect available node details, and follow source/destination links, but you cannot move, resize, configure, or delete diagram elements.
Hover over an element and choose Show Details where available to open its details panel. Use the panel’s close button to return to the diagram.
To follow a source/destination link, choose Go to destination and confirm with Continue. The Back button returns to the previous schematic within the viewer. Viewer navigation does not change the schematic selected in the editor.
Live Readings
Live equipment indicators, meters with assigned tags, and tag-based labels display reading health, value, units, and the source’s last-reading timestamp. Static labels and unbound meter symbols remain static. Label orientation, rounding, and Show Units settings are preserved.
Readings and assigned data maps refresh every ten seconds while the schematic is active in the foreground. Switching tags or maps clears the previous indicator while the new binding loads.
Current means the reading has good source quality and a valid timestamp less than five minutes old. It does not mean the equipment or process is safe; that interpretation comes from the configured map condition and entry name.
Stale means the source timestamp is at least five minutes old, even if a recent request returned the same reading. Bad quality and Suspect quality reflect the source’s quality classification. Unknown covers unavailable values, failed requests, missing or future timestamps, and unusable mappings. These states use a neutral indicator rather than retaining a previous mapped colour. When available, noncurrent readings are labelled Last value.
Tank fill is displayed only for current numeric readings between 0 and 100 with percentage units (%, percent, or percentage). Other units, out-of-range values, and noncurrent readings show an unknown level without fill or animation; the status panel explains the problem and retains the last supported value. Values are no longer silently clamped to an empty or full tank.
For information about updating an existing schematics, see Configure Schematics.