Set Up Tags
You can create, update or delete tags from the Tag Configuration pane, which you can access under Configuration ‣ Data Management ‣ Tags from the menu.
This pane displays tag data in a grid, with a specific row for each tag. You can use the standard grid functions to manage the items or layout of the pane. For more information, see Grid Functions.
Create Tags
On the Tag Configuration pane, click
 Add on the toolbar.
In the Tag Definition dialog, enter the required values in the following fields:
Field
Description
Tag Name
Enter a name that uniquely identifies the tag.
Description
Provide additional information about the tag’s purpose.
Data Type
Select the type of data to be stored.
Engineering Units Type
Select the engineering units associated with the data to be stored in the tag. For example, distance, temperature, and so on.
Default Value
Specify a default value to be used if no other incoming value is available.
Save your entries.
Edit Tags
On the Tag Configuration pane, select the tag that you want to edit. You can edit only one tag at a time.
Click
 Edit on the toolbar.
In the Tag Definition dialog, update the values as required.
Save your entries.
Delete Tags
On the Tag Configuration pane, select the tags that you want to delete. You can select multiple tags at a time.
Click
 Delete on the toolbar.
Confirm the deletion.
Update Current Value and Data Quality
You can update the current value and data quality (see Data Quality) associated with a tag as follows:
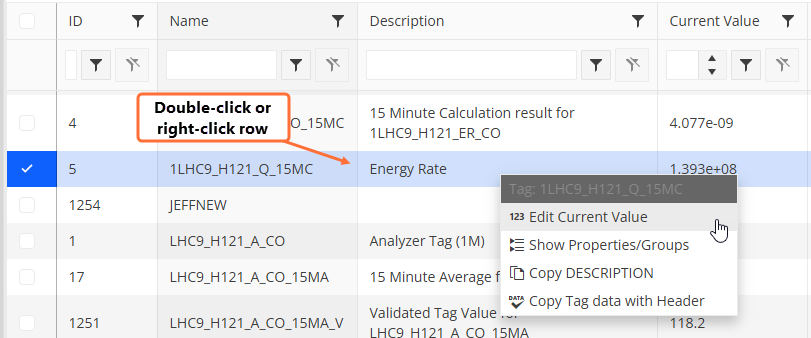
Double-click the row of the relevant tag, or right-click it and select Edit Current Value from the context menu.

In the dialog that opens, update the values as required.
Save your entries.
Review Trends
The Trends functionality allows you to visualise the historical values of selected tags. You can display historical values for one or more tags and adjust the time period as required.
To review trends, follow the steps below:
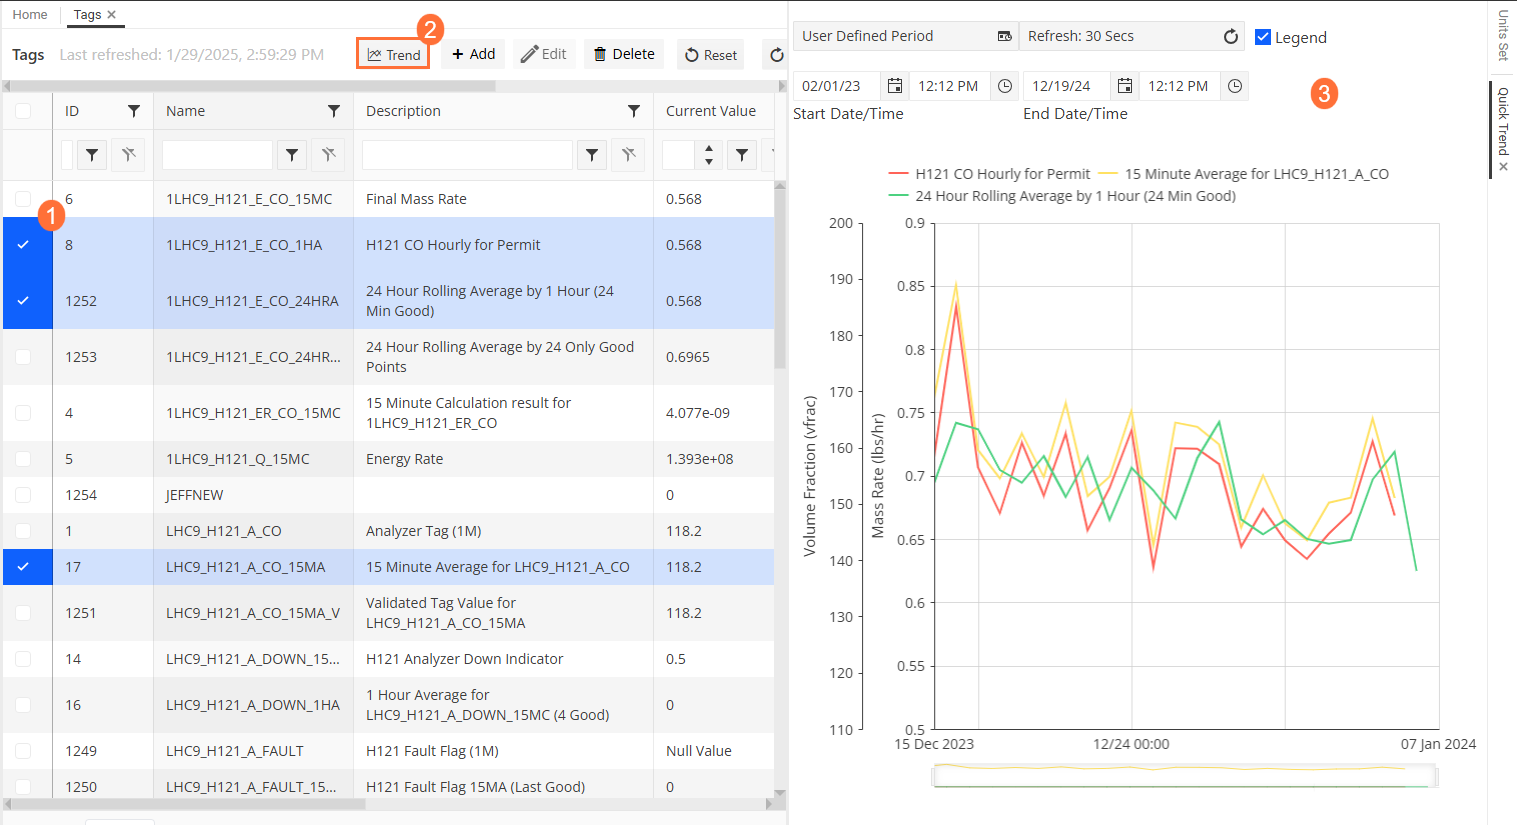
On the Tag Configuration pane, select one or more tags as required.
Click the Trend button on the toolbar.
Review the charts in the Quick Trend panel that appears on the right side of the screen. On this panel, you can also adjust the period, the refresh rate and display or hide the legend.

Track Tag Dependencies
You can review tag dependencies, including tags, flowsheets, aggregations, and events to understand how different components are interconnected within the system.
To review trends, follow the steps below:
On the Tag Configuration pane, select one or more tags as required.
Click the Track button on the toolbar.
In the Tracker View pane that opens, review the tag dependencies as described in Tracker View.