Tracker View
The Tracker View is designed to display tag dependencies, including tags, flowsheets, aggregations, and events. This view helps users understand how different components are interconnected within the system.
Tracking Tags
Navigate to .
In the top-left section of the Tracker View pane, specify your selection criteria:
Max Depth: Select the level of dependency depth that you want to track.
1: Shows only direct dependencies.
2 and higher: Includes deeper levels of dependencies. You can enter any positive integer to define how far the system should trace dependencies. Note though that entering a large number may result in a very complex and extensive dependency map, which can be difficult to interpret and may take longer for the system to process and render.
The default value is 1.
Direction: Choose which types of dependencies to display:
Incoming: Shows only elements that provide data to the selected tags.
Outgoing: Shows only elements that receive data from the selected tags.
Both: Displays both incoming and outgoing dependencies.
Select Tags: Click the dropdown button to open the Search dialog. You can:
Browse the tag list
Search and filter tags
Select one or multiple tags
Click Close to exit the Search dialog.
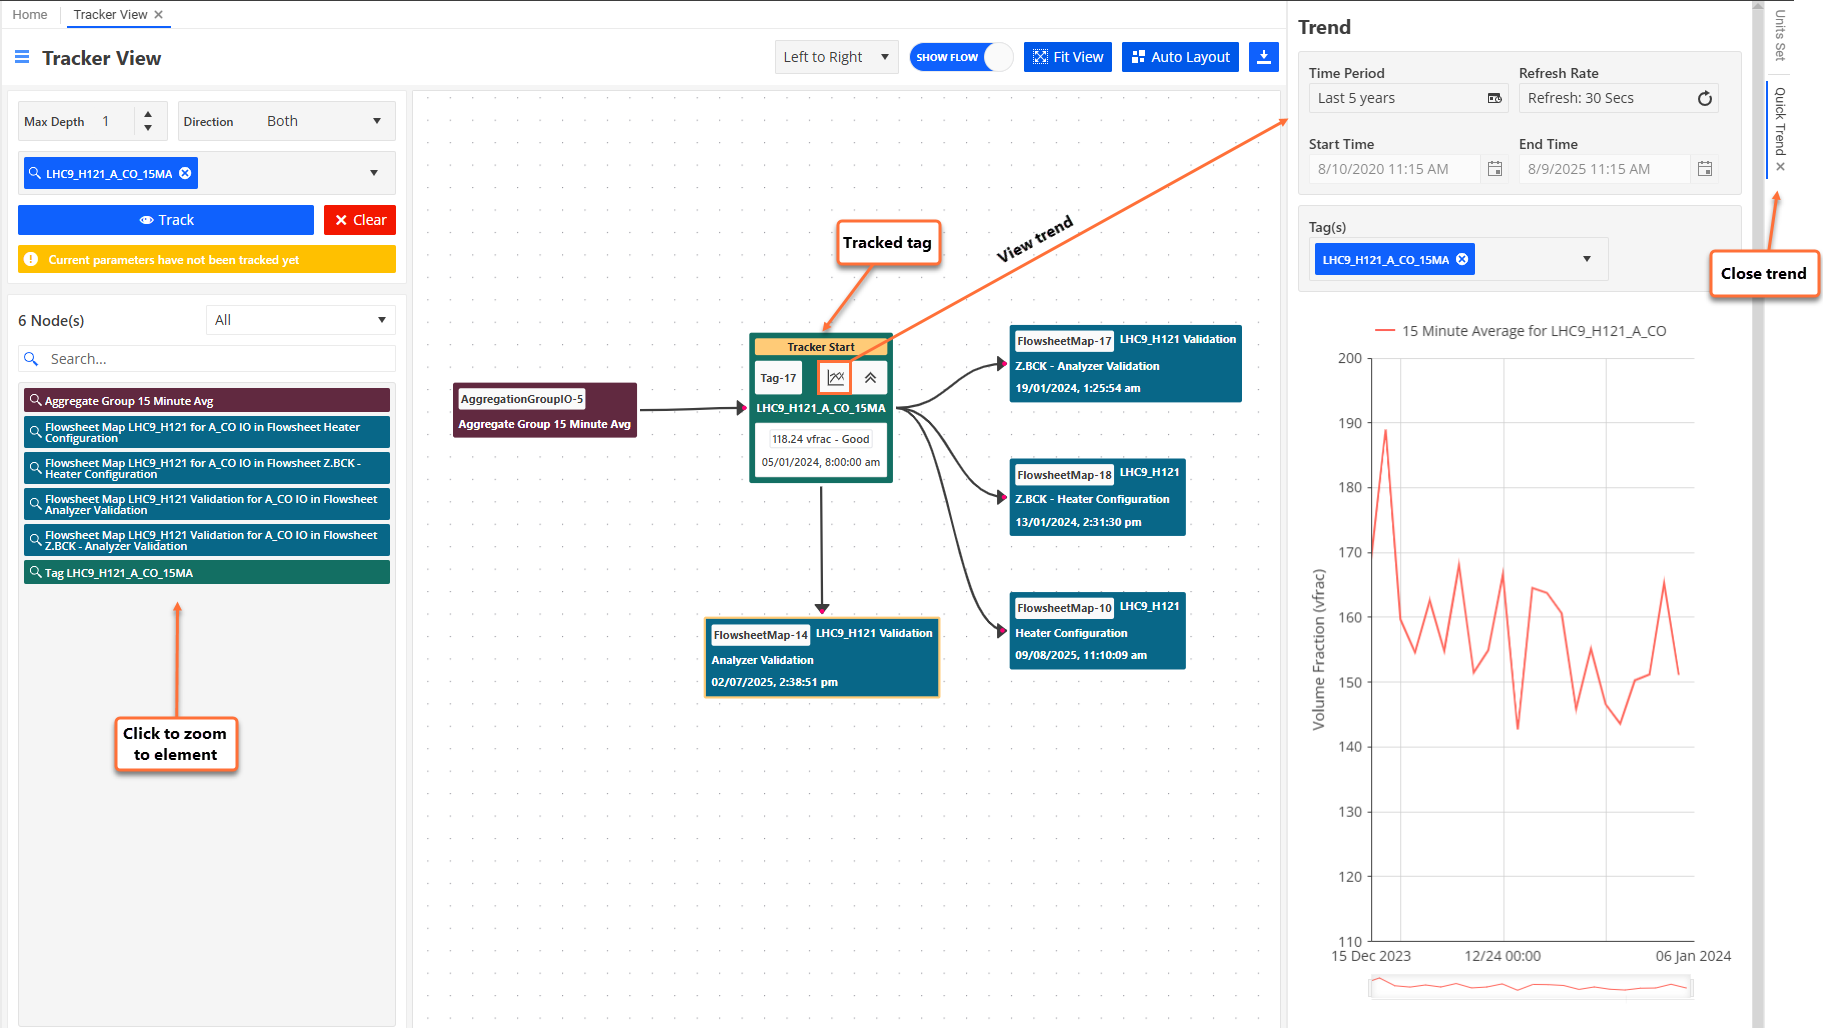
Choose the Track button.
Result
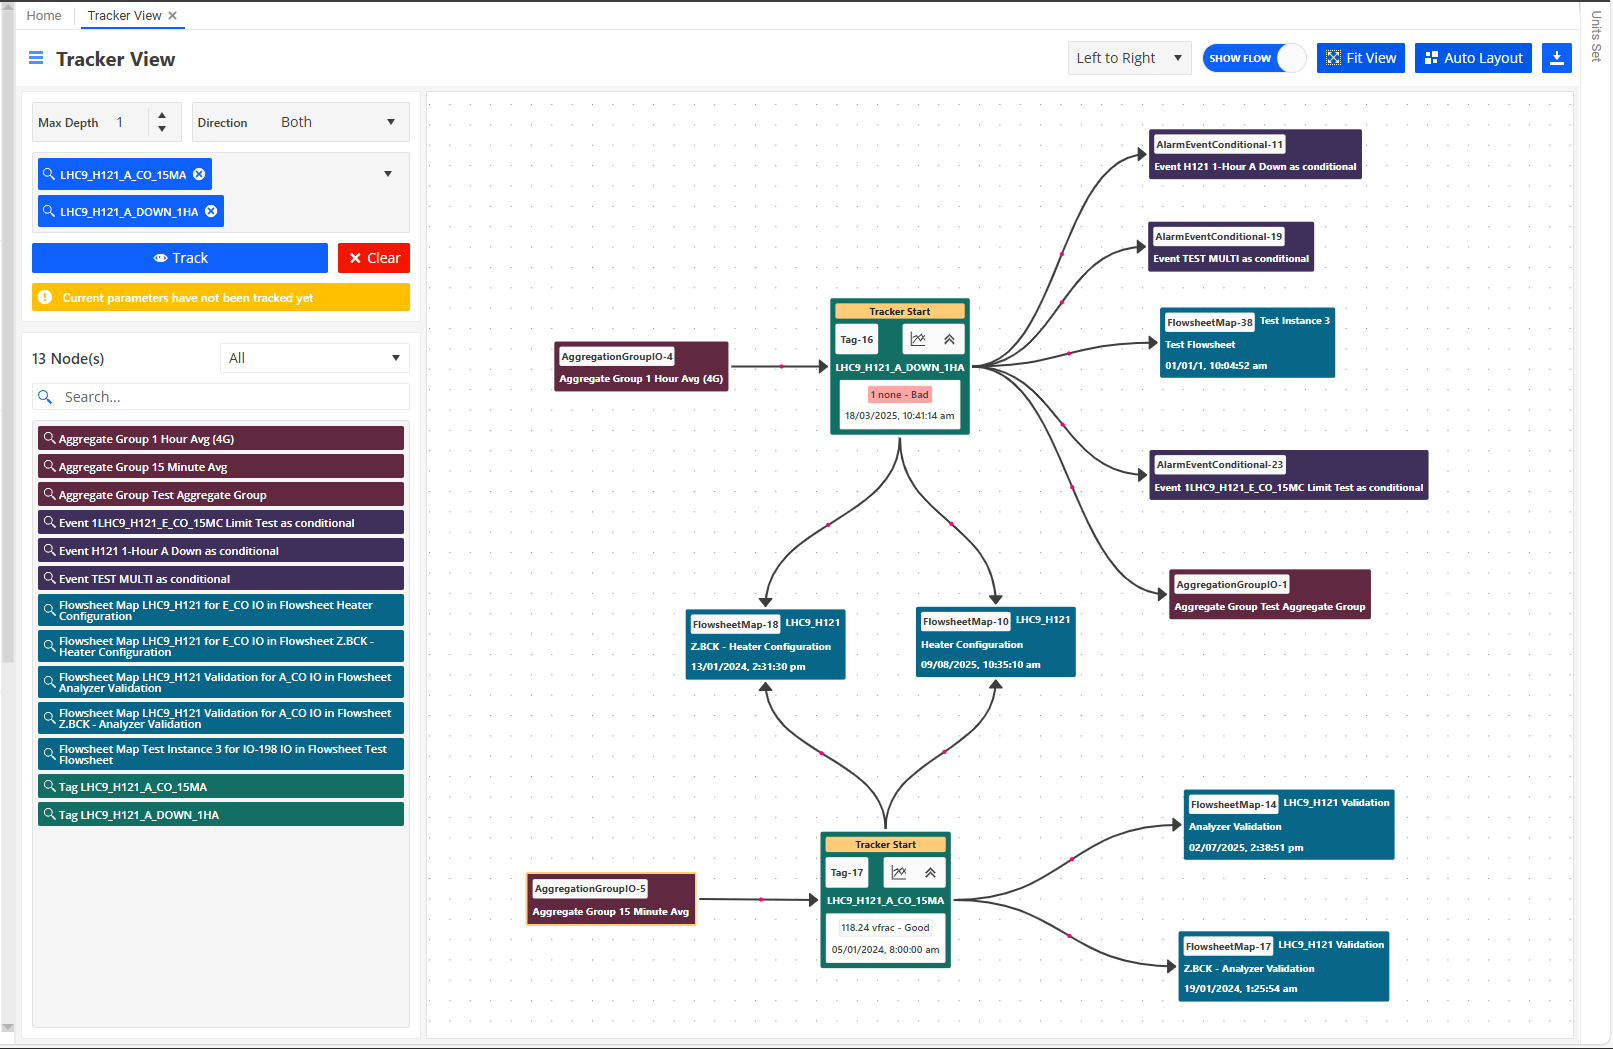
The tracked tags and their dependencies will appear in the viewing area. Example with 2 tracked tags:
Adjusting the Tracker View
Use the controls in the top-right section of the Tracker View pane to customise the display:
Flow Direction: Choose the layout direction: Left to Right, Top to Bottom, Right to Left or Bottom to Top.
Show Flow: Toggle to show or hide data flow. When enabled, red dots animate along arrows to indicate flow direction.
Fit View: Automatically adjusts the view to fit all elements.
Auto Layout: Resets the layout to its default arrangement.
Download: Click the Download icon to save the view as a PNG image.
Reviewing Tracked Data
After tracking tags, you can review the data as follows:
Tracked tag elements are marked with a yellow Tracker Start label.
Each tag element displays the basic parameters of the tag, such as name, current value, quality.
Click the Trend icon to open the Quick Trend tab on the right. This shows historical values of the tag.
The left side of the pane lists all elements in the dependency map. Clicking an item zooms the view to that element.