Dashboards
Wood InsightsPlatform (WIP) offers powerful dashboarding capabilities for visualising data within the WIP framework.
WIP includes a plug-in for the Grafana application, enabling the creation of dashboards within the Grafana framework. By leveraging the Grafana dashboarding engine, users can create complex and rich visuals. For more information on using Grafana dashboards, please refer to the Grafana documentation.
Prerequisites
Before you can add dashboards in WIP, the dashboard must be created in the Grafana application and a WIP data source must be created there to connect WIP to Grafana.
Add Dashboards in WIP
Once you have a dashboard created in Grafana, you can link it to the Dashboard section in WIP by following these steps:
In the Navigation sidebar, add a new node in one of the following ways:
Right-click on the Dashboard section and choose
 Add Dashboard.
Under Dashboard, click anywhere in the hierarchy and choose
Add.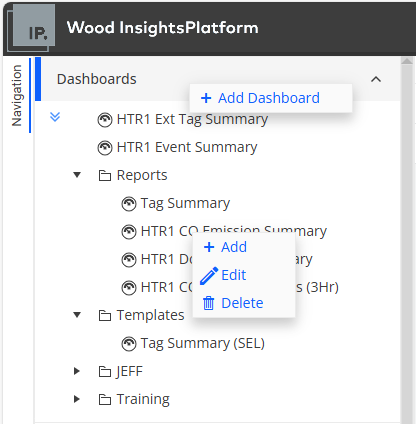
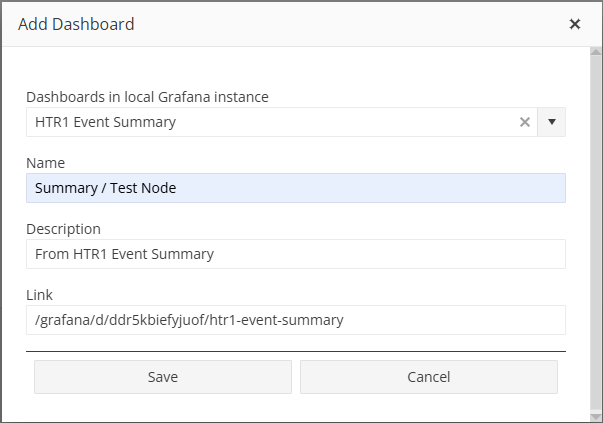
In the Add Dashboard dialog, enter data as follows:
Field
Description
Dashboards in local Grafana instance
Select the dashboard that has been previously created in Grafana and link it.
Name
Enter a name that identifies the dashboard. If you want to add the dashboard under an existing grouping node, precede the new dashboard name with the name of the grouping node followed by a slash (/), using the format: <Grouping Node Name> / <New Dashboard Name>. For example, if your grouping node is “Summary” and your dashboard is “Test Node”, you would enter “Summary / Test Node”.
Description
Enter any additional information about the dashboard as required.
Link
If you selected a dashboard in the Dashboards in local Grafana instance field, this link is automatically added. If you have not selected a dashboard from a local Grafana instance, you can copy the link manually from the Grafana application and paste it here.
Save your entries.
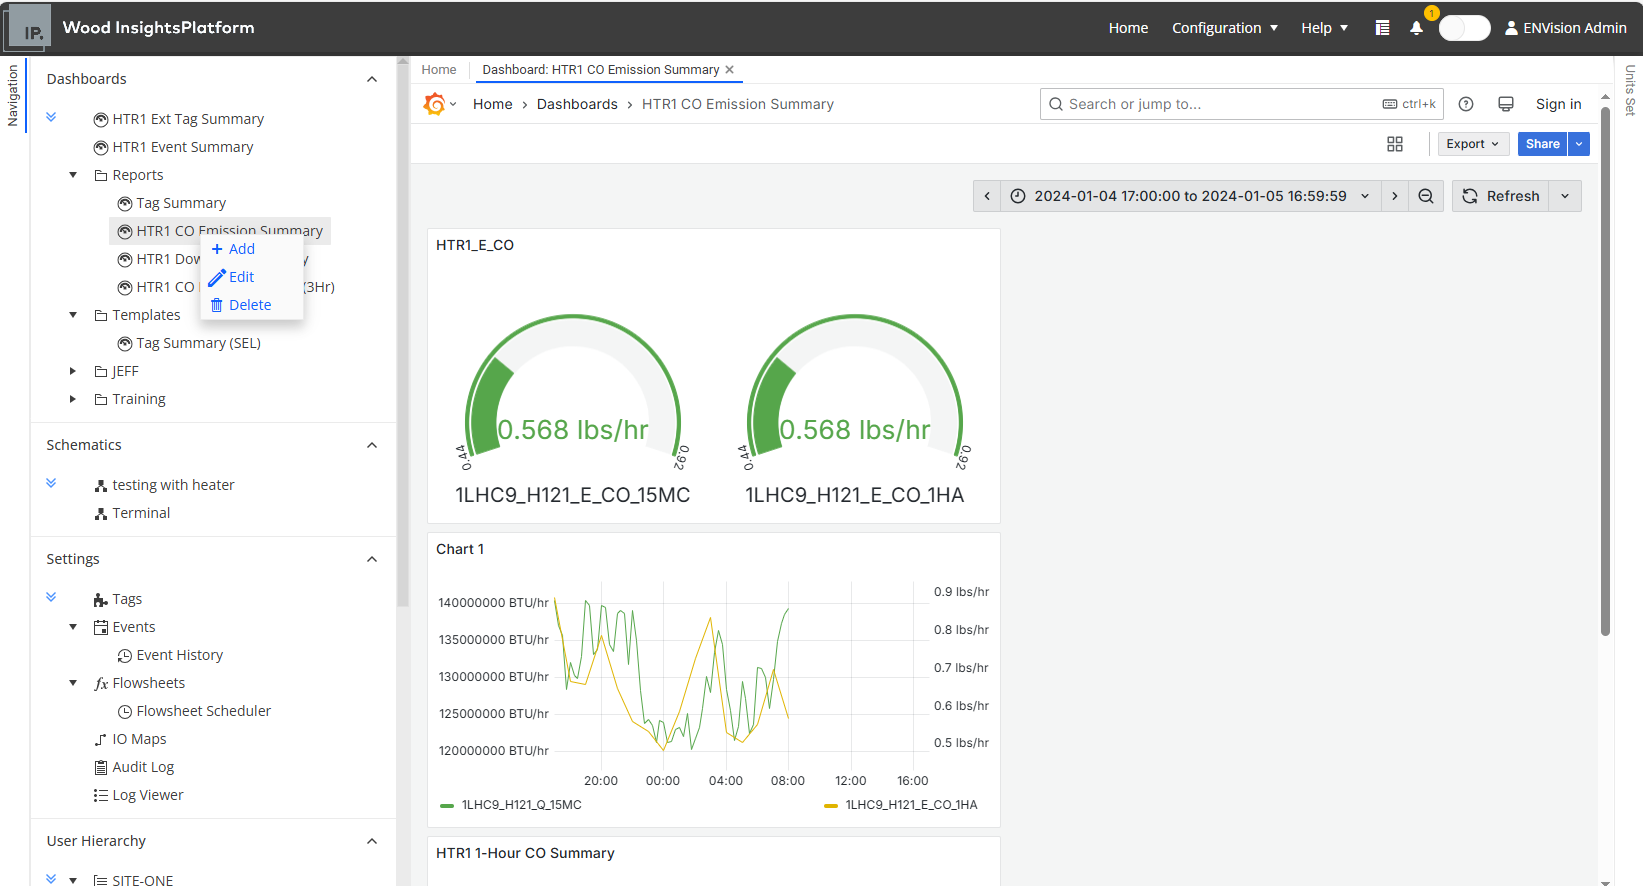
Result
The dashboard gets added to the list of dashboards in the Navigation sidebar and you can view its content in the main viewing area. You can update or delete the dashboard any time by right-clicking the node in the list and selecting the relevant context menu option.
Add Grouping Node to Dashboards Hierarchy
You can insert a new dashboard directly under a new grouping node as described below:
Begin adding a new dashboard using any of the methods described previously.
In the Add Dashboard dialog, fill in the required data for the new dashboard. In the Name field, precede the dashboard name with the name of the new grouping node followed by a slash (/), using the format: <Grouping Node Name> / <New Dashboard Name>. For example, if your grouping node is “Summary” and your dashboard is “Test Node”, you would enter “Summary / Test Node”.
Save your entries.
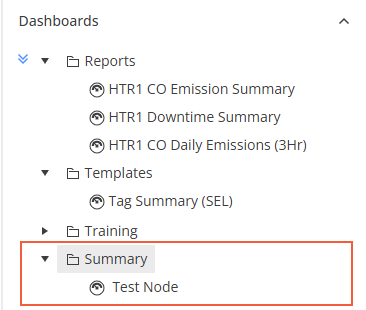
Result
The new dashboard gets added to the hierarchy under the new grouping node: