Log Viewer
The Log Viewer provides visibility into the internal operations of the WIP infrastructure. It allows users to access logs from each WIP service and view messages across different severity levels, such as informational messages, warnings, and critical errors. This makes it a valuable tool for troubleshooting and diagnostics.
To access the Log Viewer, navigate to from the Navigation sidebar.
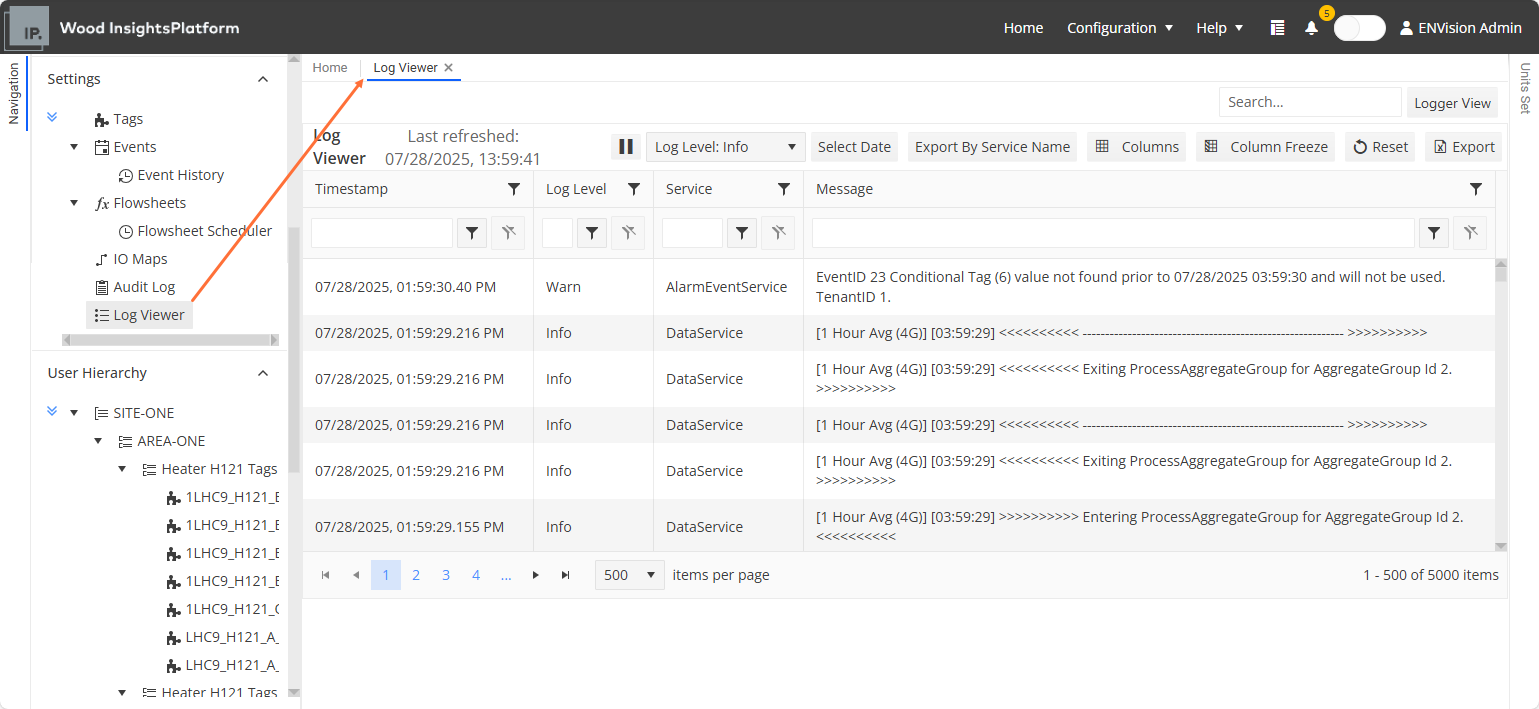
You can filter log entries using the standard filtering options (see Filtering). In addition to standard grid functions, the toolbar provides the following features:
 Pause Logging: Temporarily stops the live log feed, allowing you to review entries without automatic refresh.
Log Level dropdown: Filters logs by severity level (for example, Info, Warning, Error, Fatal). The default level is Info. If you change it, remember to reset it to Info afterward to avoid performance issues.
Select Date: Filters logs by a specific date range.
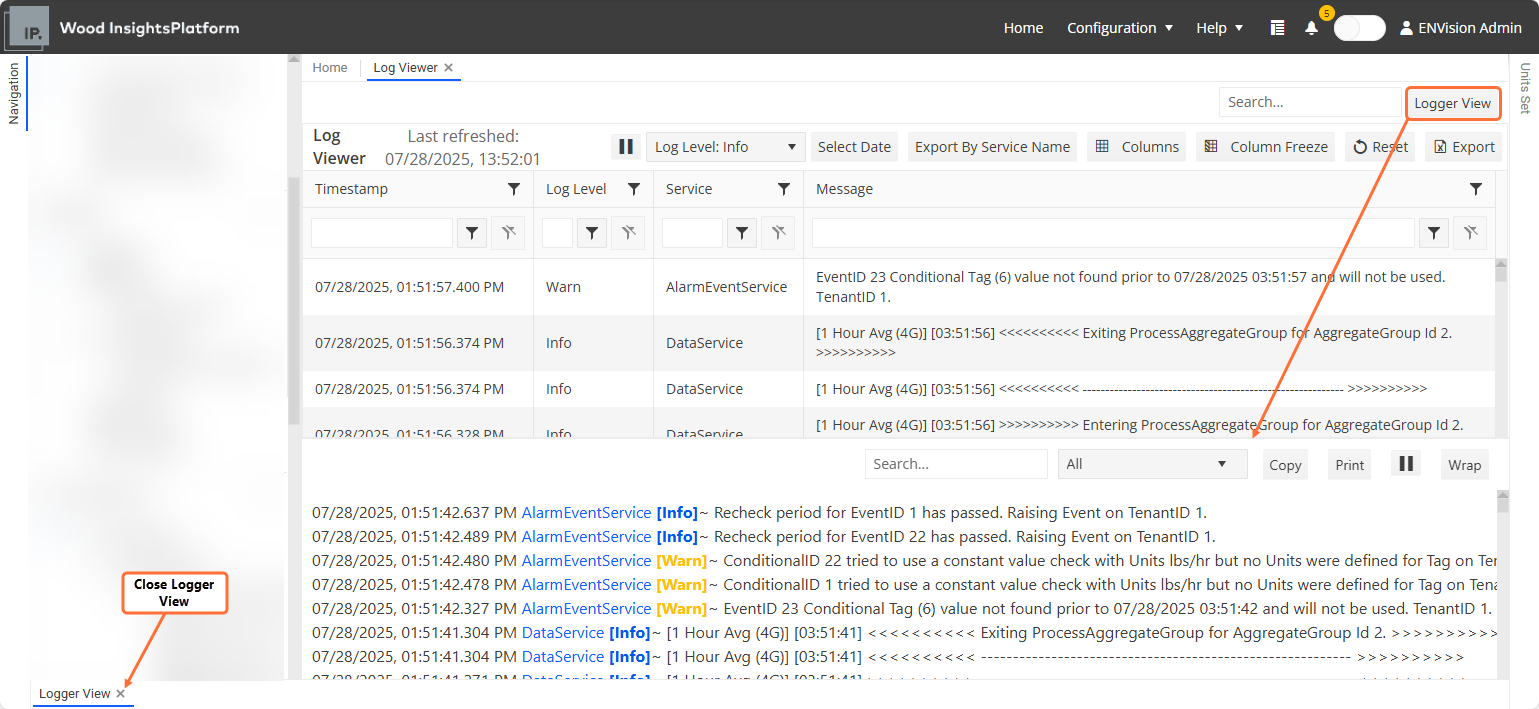
You can also click the Logger View button at the top of the pane to open a dedicated viewing panel at the bottom of the interface. This panel allows you to:
View logs while analysing other parts of the system
Filter logs by service
Copy or print log entries
Pause logging independently from the main view
You can close the Logger View from the bottom-left section of the screen: